Micrometer (Prometheus) to Grafana dashboard Convertor
How to use the Convertor
Often we need to set up new Grafana dashboards for our own applications and we can't rely on predefined dashboards from Grafana Dashboards repository.
We provide you a way convert a sample of Micrometer (Prometheus) formatted metrics to simplistic Grafana dashboard to make you get very first understanding of all trends of all metrics.
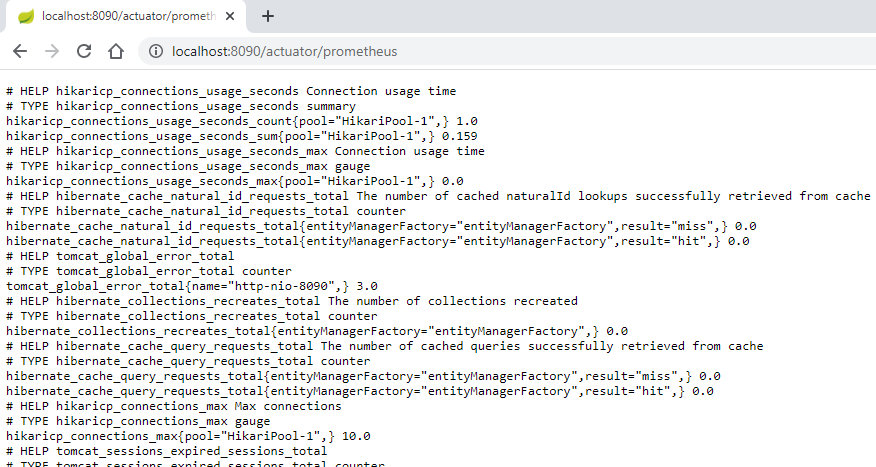
Get your Micrometer metrics example
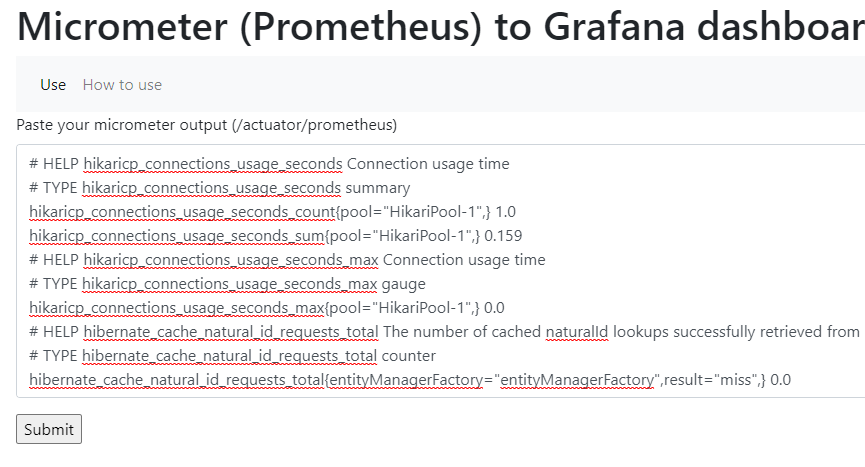
Start or access the application's URL where you have the Micrometer-format metrics
Copy metrics example
Copy the whole plain text of the metrics data and paste it to the textarea field on our site
Submit metrics example and get Grafana dashboard JSON config
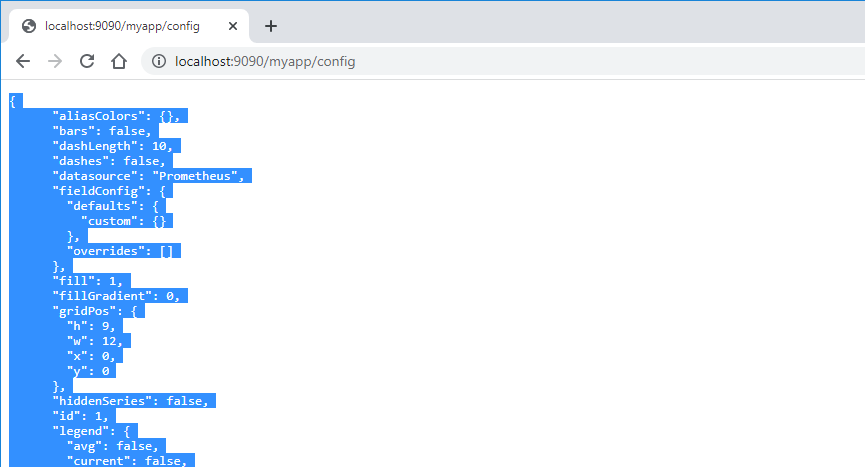
Click submit and get the resulting plain text page with the JSON config of your future Grafana dashboard, then copy it
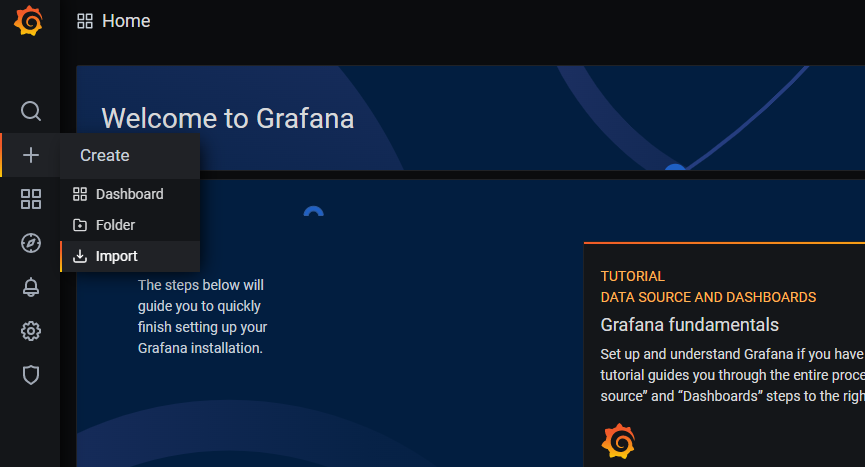
Start new Grafana dashboard import
Start new Grafana dashboard import and find the JSON config window there
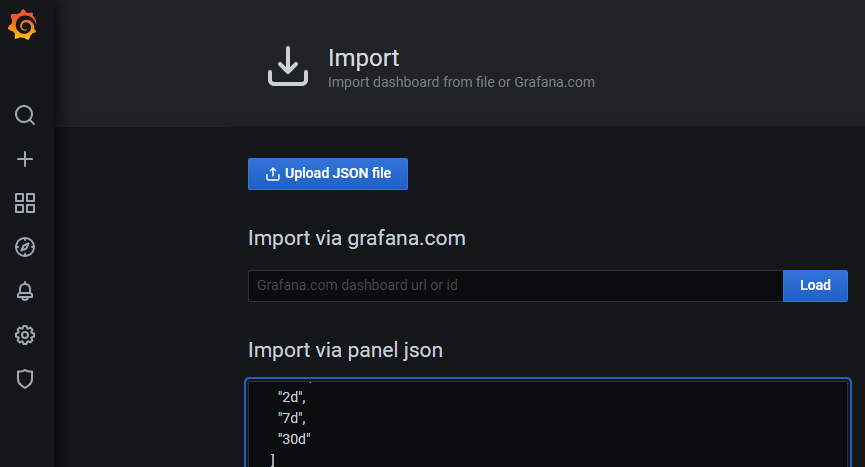
Create Grafana dashboard from the JSON config
Paste the JSON as the new Grafana dashboard. We assume you have already set up the
Prometheus
as your datasource (otherwise set it up in the form)
Enjoy the dashboard and explore the data
Take a look on the dashboard that has been generated. Metrics name is put to it's title. Feel free to customize and remove panels